Gaussian, top hat or donut? Part II: Exploring the effect of beam shape on the productivity and density of additively manufactured AlSi10Mg.
In Part I, we evaluated different laser beam shapes and process parameters with the aim of producing both dense (porosity ≤1%) and high productivity parts in AlSi10Mg with PBF-LB/M. Now, in part II, we reveal the experimental results and performance.
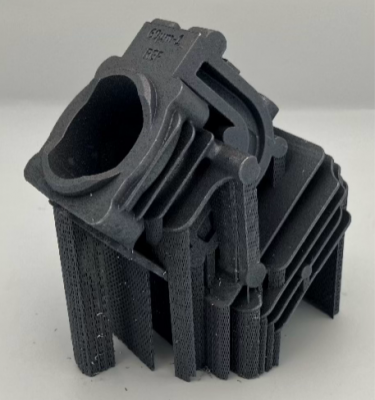


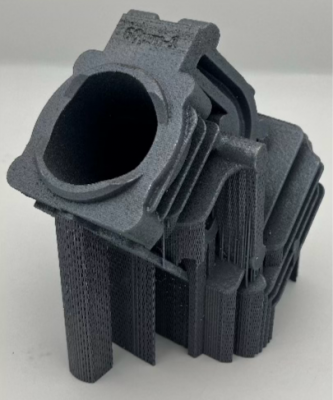

Figure 1. Cylinder head component (use-case 4) produced with 250 µm top-hat beam shape and 60 µm layer thickness.
Images: Stephanie Symons, AMEXCI Materials Lab.
A total of twenty print jobs were produced in M290 using laser technologies of both the InShaPe alpha prototype system and the nLight research platform in EOS Krailling, Germany. The build jobs served various purposes, including process and surface parameter development as well as melt pool dimension evaluation, aiming to produce high density and productivity use-case components (Figure 1), and validation specimens (density cubes, tensile bars), as well as fatigue specimens. Additionally, one reference build job was specifically produced using standard EOS parameters for 60 µm layer thickness (Gaussian beam) to produce benchmarks for use-case components, density cubes, tensile and fatigue specimens. Although 60 µm, 90 µm, and 120 µm layer thicknesses were initially considered for process parameter development within the InShaPe project, due to time constraints, the focus narrowed to 60 µm and 120 µm.
Process parameter development strategies
The results from the initial five designs of experiments (DOEs) showed a good balance between relative density and productivity using 1250W laser power with 250 µm beam spot, where the top hat beam shape had higher relative density on average compared to the donut beam shape at the same build rate (Figure 2).
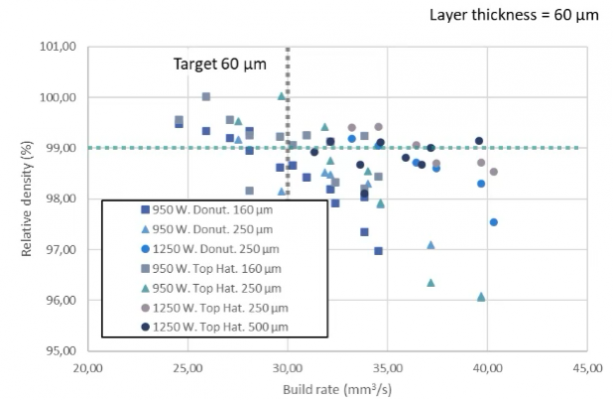

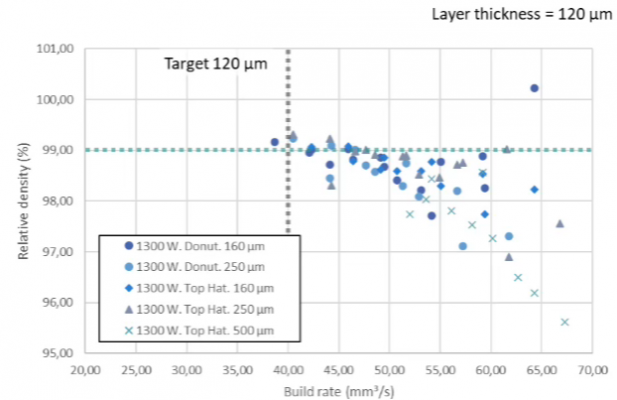

Figure 2. Relative density of cube samples produced using different combinations of beam spot size, hatch distance, laser power, laser speed and beam shapes analyzed using Archimedes density estimation.
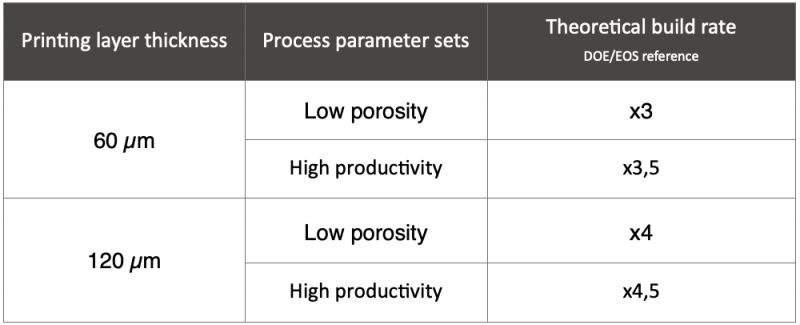
Two additional DOEs (120+ density cubes) were printed for 60 µm and 120 µm layer thicknesses with varying scan speeds and hatch distances focused around the process parameters of cubes with the most promising relative density from the initial DOEs. In the end, two process parameter sets were selected for both 60 µm and 120 µm layer thicknesses: the first (low porosity) which focused on our goal of minimizing porosity while maintaining productivity and a second (high productivity) to further push the build rate (Table 1).
Table 1. Increased productivity of parameter sets developed by InShaPe when compared to standard printing parameters by EOS (AlSi10Mg with M290).
Density of cubes and cylinder heads
The cubes were sectioned into three areas by using a longitudinal cut followed by a transversal cut as shown in Figure 3 (left). Meanwhile, the cylinder head components were sectioned to evaluate at least three areas, near the cylinder walls or the cooling fins, as shown in Figure 3 (right).
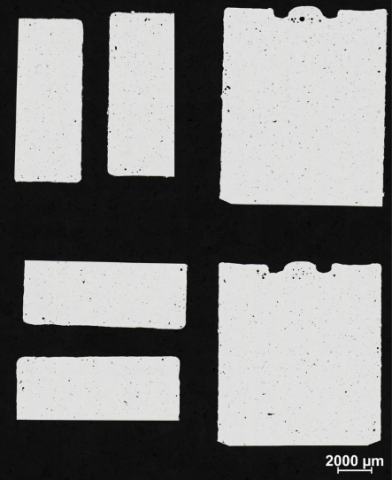

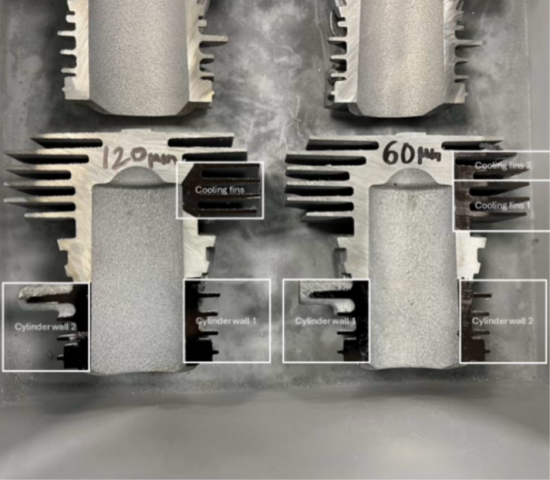

Figure 3. Example of sections used for the porosity evaluation in (left) two cubes and (right) cylinder head components. Images: Stephanie Symons, AMEXCI Materials Lab
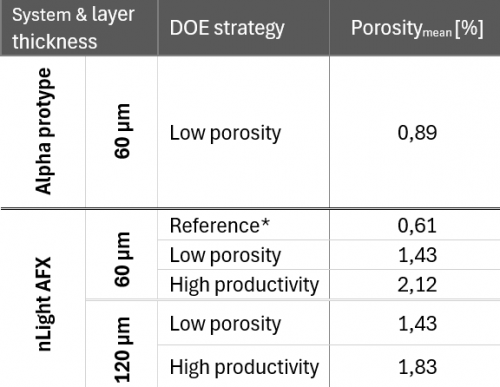
DOEs targeting high productivity tended to show increased porosity compared to those optimized for high density. As shown in the Table 2, porosity percentage of cubes varied depending on the process parameter sets’ strategy and which beam shaping technology was used where the Alpha prototype systems generally had higher densities than nLight AFX under similar conditions, particularly when printing with 60 µm layer thickness. Unfortunately, the Alpha prototype system became unstable during printing, therefore all cylinder heads except for one were printed using the nLight AFX. Due to time constraints within the project, further exploration using the Alpha prototype was not feasible; however, it presents an interesting opportunity for future work beyond the scope of this study.
Table 2. Summary of cube porosities [%] measured by contrast-based analysis using light optical microscopy (Nikon LV150N) and NIS-Elements BR software.
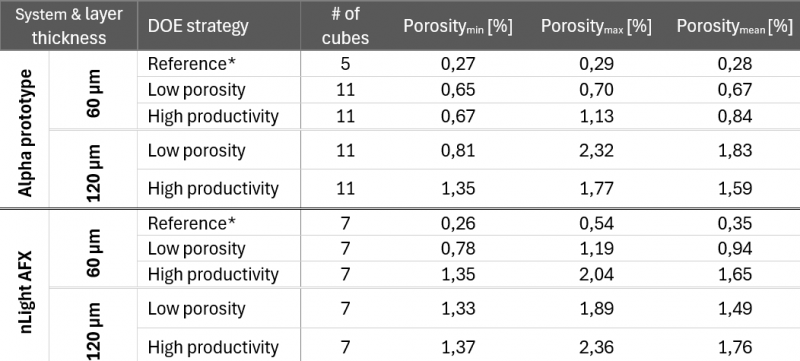
*The reference cubes were printed in the EOS M290 fitted with the alpha prototype system or nLight AFX with beam shaping turned off, using Gaussian.
As expected, in comparison to density cubes, porosity increased when larger, more complex cylinder head parts were printed (Table 3), where higher porosity was observed in cross sections near the cooling fins.
Table 3. Mean cylinder head porosities [%], printed with 60 µm and 120 µm layer thickness, measured by contrast-based analysis using light optical microscopy (Nikon LV150N) and NIS-Elements BR software.
*The reference cylinder head was printed in the EOS M290 fitted with nLight AFX with
beam shaping turned off, using Gaussian.
The data reveal a clear trade-off between productivity and part quality when using newly developed low porosity and high productivity parameter sets with beam shaping technology. While both parameter sets lead to increased porosity (especially when applied to complex geometries like cylinder heads) they also offer a significant increase in theoretical build rate compared to the standard EOS reference parameters as indicated in Table 1. These results highlight a critical balance: while faster parameters can dramatically improve manufacturing throughput, they may not yet provide sufficient quality for AlSi10Mg applications where high density is essential.
Mechanical Properties
Tensile properties
Initially, two print jobs with varying process parameters were manufactured to obtain a preliminary evaluation of the mechanical properties of samples. The preliminary results showed that process parameters closest to the selected DOE strategies (based on density) met the key performance indicators, confirming the validity of our process parameter selection. Next, for each set of the selected process parameters, 10 tensile samples were printed alongside the cylinder heads using the nLight AFX system at 60 µm (reference, low porosity, and high productivity parameters) and 120 µm (low porosity and high productivity parameters). Here it is relevant to highlight that 240 MPa ultimate tensile strength and 70 GPa Young’s modulus were used as key performance indicators (KPIs) for AMEXCI’s use-case application within the InShaPe project.
Tensile specimens produced with high productivity parameters in both 60 and 120 µm layer thicknesses achieved average Young’s moduli of 68 ± 3 GPa and 69 ± 1 GPa, respectively, which is just below the target KPI of 70 GPa (Figure 4). Similar results were observed for ultimate tensile strength where high productivity parameters also fell slightly short of the 240 MPa target KPI (60 µm: 223 ± 35 MPa and 120 µm: 224 ± 17 MPa; Figure 5). On the other hand, the low porosity parameters successfully reached both targets showing that beam shaping can increase in productivity of x3 for 60 µm layer thickness and x4 for 120 µm layer thickness compared to standard printing parameters. Other mechanical properties, such as yield strength (Figure 6) and elongation after fracture (Figure 7) are also presented, although no reference requirements were established for these properties.
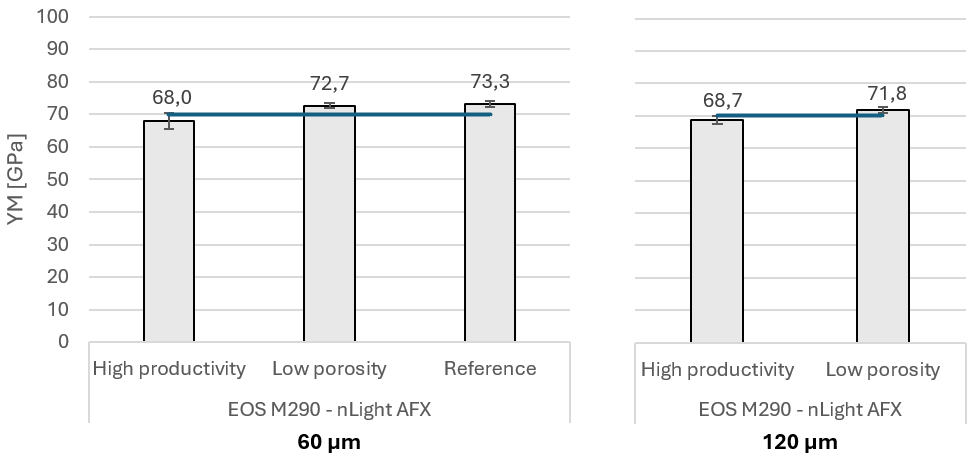
Figure 4. Average Young’s modulus (YM) of samples printed with 60 and 120 µm layer thickness. The high productivity and low porosity process parameter sets were developed by the InShaPe project, where the reference process parameters are the standard process parameters for 60 µm layer thickness. The blue line at 70 GPa shows the key performance indicator for this mechanical property. Error bars around the mean represent one standard deviation.
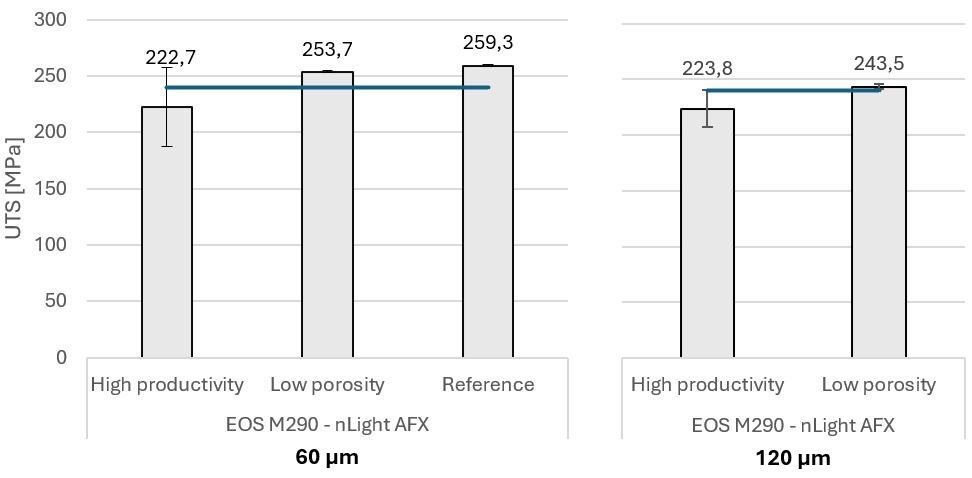
Figure 5. Average ultimate tensile strength (UTS) of samples printed with 60 and 120 µm layer thickness. The high productivity and low porosity process parameter sets were developed by the InShaPe project, where the reference process parameters are the standard process parameters for 60 µm layer thickness. The blue line at 240 MPa shows the key performance indicator for this mechanical property. Error bars around the mean represent one standard deviation.
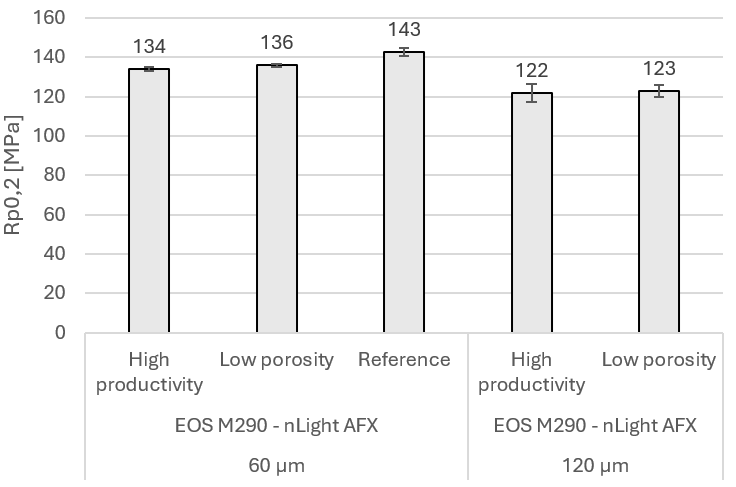
Figure 6. Average yield strength (Rp0,2) of samples printed with 60 and 120 µm layer thickness. The high productivity and low porosity process parameter sets were developed by the InShaPe project, where the reference process parameters are the standard process parameters for 60 µm layer thickness. Error bars around the mean represent one standard deviation.
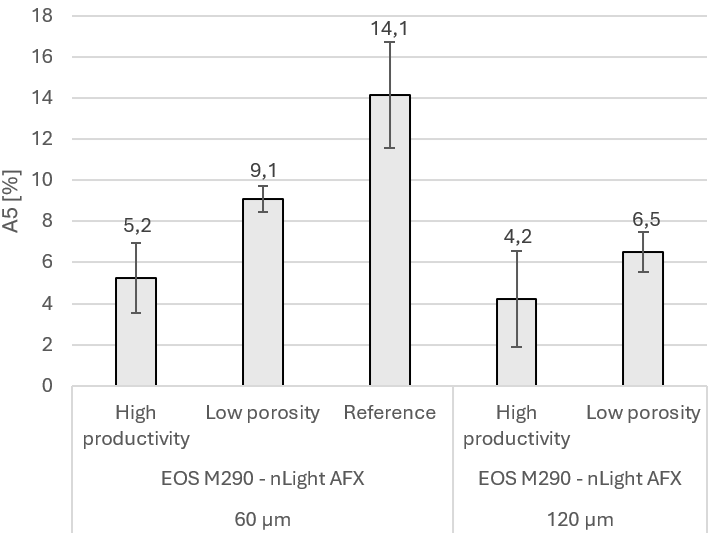
Figure 7. Average elongation after fracture (%) of samples printed with 60 and 120 µm layer thickness. The high productivity and low porosity process parameter sets were developed by the InShaPe project, where the reference process parameters are the standard process parameters for 60 µm layer thickness. Error bars around the mean represent one standard deviation.
Fatigue properties
Fatigue testing was conducted at the Institute of Metals and Technology (IMT), Slovenia, using a StepLab Electrodynamic testing machine UD020 machine at high temperature (240°C) where the loading was imposed only in tension (R=0.1). Seventeen and eighteen specimens were used to establish S/N curves with printing parameters according to EOS standard for M290 (hereafter, reference) and 60 µm-low-porosity parameters (hereafter, beam shaping) developed by InShaPe, respectively. All fatigue specimens were printed in the vertical direction and stress relieved at 300°C for 2 hrs. Before testing, specimens were machined and polished to reduce surface roughness.
For the case component under consideration, the material should sustain 5×10⁶ cycles when a maximum stress of approximately 100 MPa is applied at 250 °C. Due to limitations within the testing equipment, samples were only able to reach 240 °C. In Figure 8, it can be observed that the fatigue performance of samples printed with beam shaping was lower than the reference samples. Fatigue life with 50% certainty was 73 MPa for beam shaping specimens and 86 MPa for reference specimens.
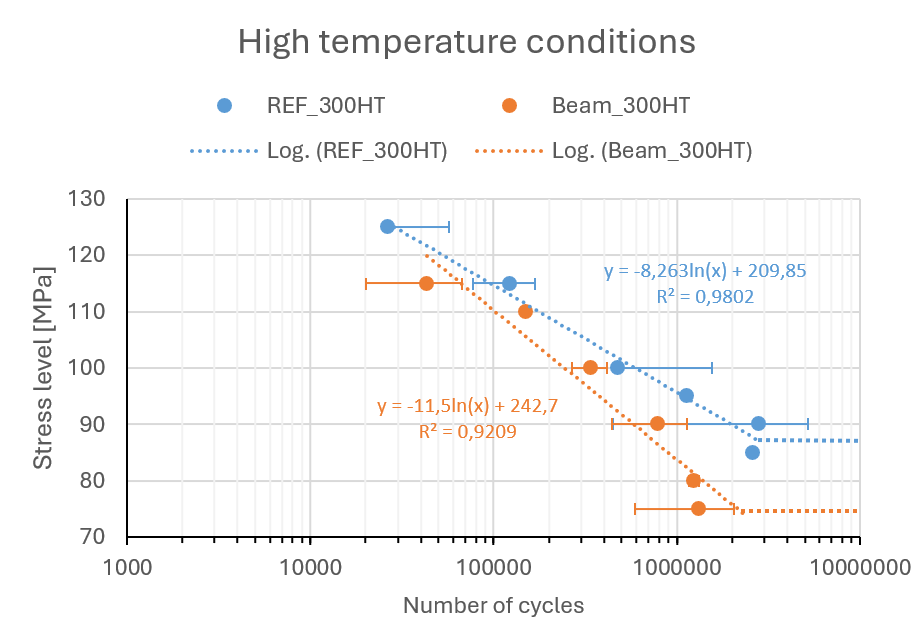
Figure 8. S/N curves for the specimens tested at high temperature (240 °C) printed with EOS standard parameters (blue) and InShaPe low porosity beam shaping parameters (orange).
The lower fatigue life observed with beam shaping is likely a result of increased porosity within the samples. As we observed a 2-fold increase in the porosity of cylinder heads (Table 3) printed with the low-porosity beam shaping parameters compared to the reference parameters, this could lead to faster crack initiation.
Other challenges
- Porosity vs. Productivity: the 250 µm top-hat parameters result in higher porosity than commercial systems. This indicates a trade-off between productivity and material quality. Further optimization of parameters such as scan speed, power, hatch distance is needed but is beyond the scope of the remaining InShaPe project timeline.
- Parameter Transferability: Two systems were used for the density determination of cubes and a comparison of one cylinder head. Differences in densities across DOEs may stem from parameter instability, system differences, or limited parameter transferability. Due to time constraints, we were unable to further compare the two beam shaping systems.
Date: 27-05-2025